
Digital Marketing Dashboards: A Clearer View of Your Performance
Digital marketing can involve many channels, campaigns and measures of success. A digital marketing dashboard brings the most useful information together in one place, helping you see how your activity is performing and where attention may be needed.
What is a digital marketing dashboard?
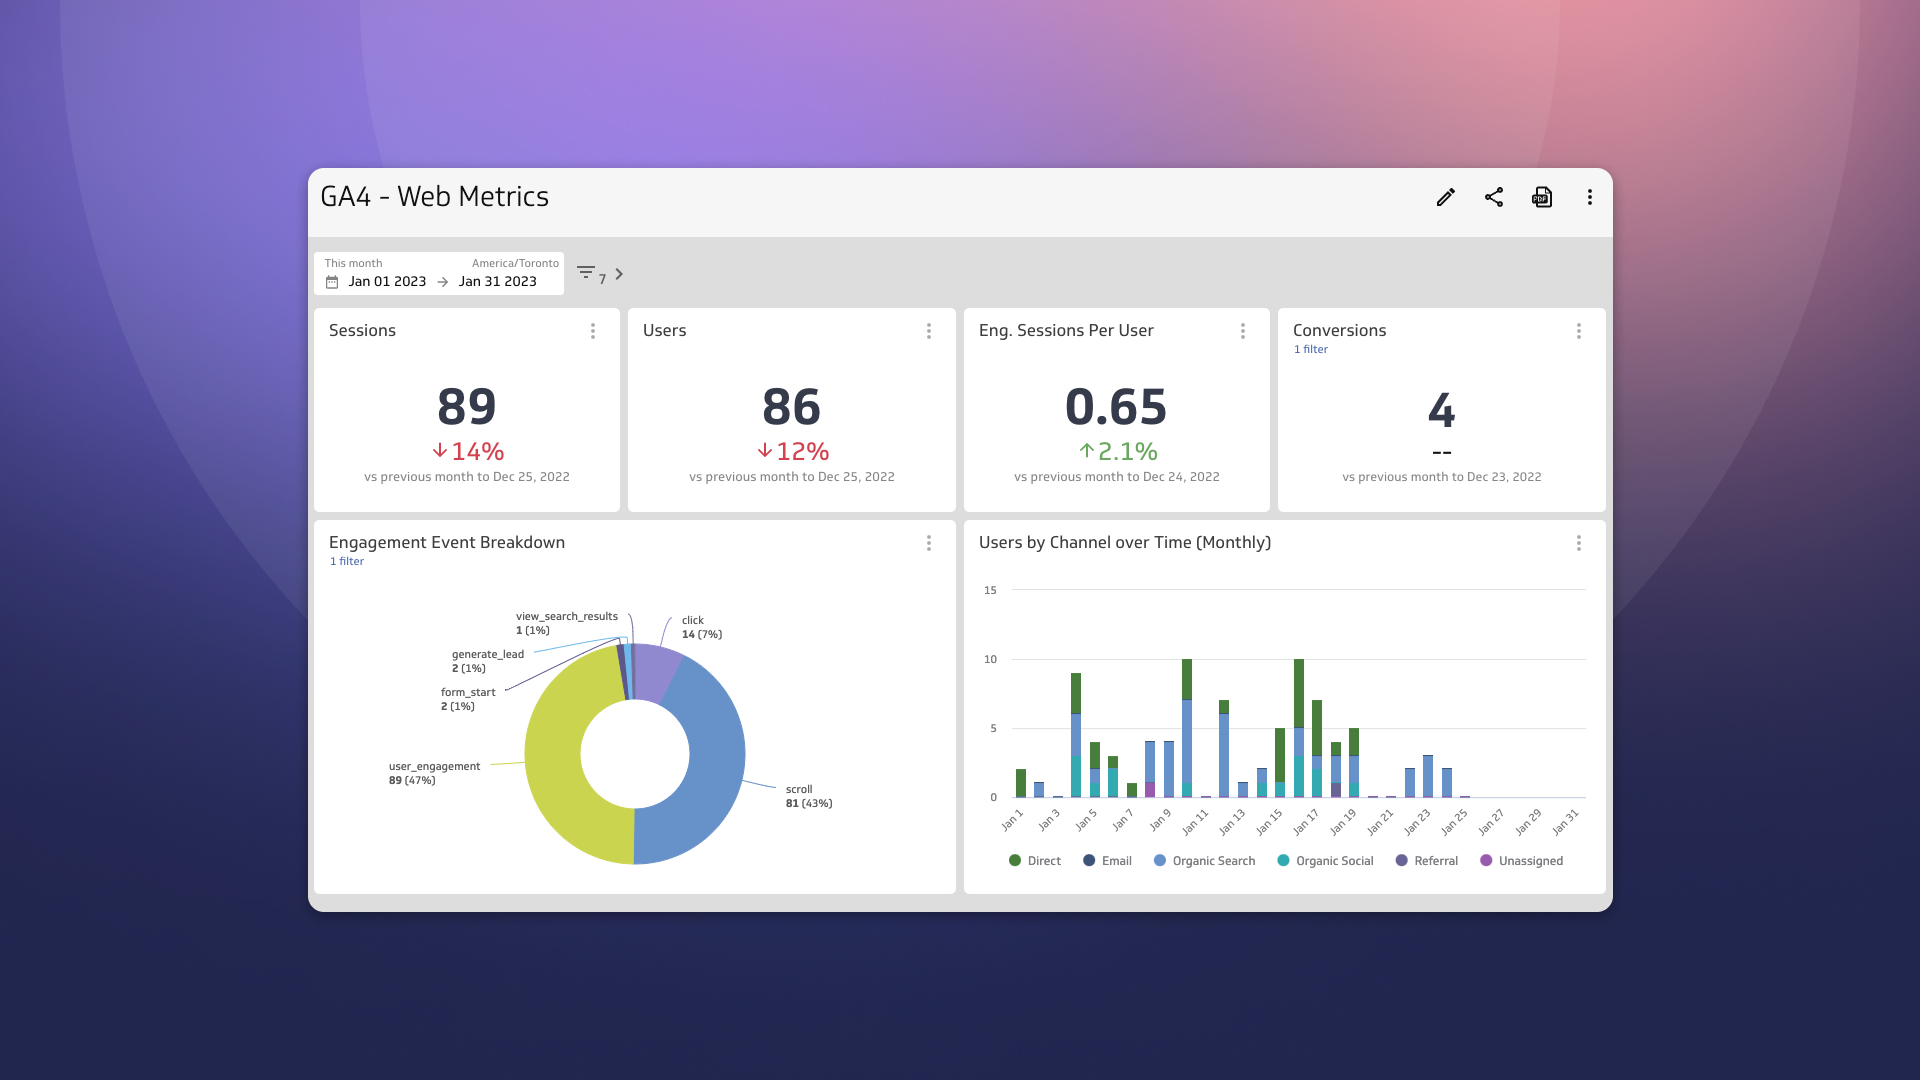
A digital marketing dashboard is a visual report that collects and displays data from marketing platforms and analytics tools. Depending on your needs, it might include information from your website, search campaigns, social media accounts, email platform and customer relationship management (CRM) system.
Rather than switching between several tools or reviewing long reports, a dashboard gives you a consolidated view of selected metrics. It can be used for regular monitoring, campaign reviews and management reporting.
Why use a dashboard?
A well-planned dashboard can make marketing data easier to understand and act on. It can help you:
- Monitor performance across different channels.
- Compare results with campaign objectives and targets.
- Spot changes or trends that may require investigation.
- Share consistent reports with colleagues, clients or stakeholders.
- Spend less time gathering figures manually.
A dashboard does not make decisions for you. Its value lies in making relevant information more accessible, so your team can ask better questions and decide what to do next.
What should a digital marketing dashboard include?
The right measures depend on your business, audience and goals. A dashboard for an online retailer may focus on revenue and orders, while one for a business-to-business organisation may track enquiries and lead quality.
Common measures include:
- Website performance: sessions, traffic sources, landing-page activity and conversions.
- Search engine optimisation: organic traffic, search visibility, rankings for selected terms and enquiries from organic search.
- Paid advertising: spend, impressions, clicks, click-through rate, cost per click and conversions.
- Social media: reach, engagement, audience growth, referral visits and campaign results.
- Email marketing: delivery, clicks, unsubscribes and conversions, where these measures are available and appropriate.
- Lead generation: enquiries, qualified leads, conversion rates and progress through the sales process.
It is usually more useful to select a focused set of measures than to display every figure available. Each metric should have a clear purpose and relate to a business or marketing objective.
Choose metrics that support your goals
Before building a dashboard, decide what you want your marketing to achieve. Goals might include increasing online sales, generating qualified enquiries, improving brand awareness or encouraging repeat purchases.
Then identify the measures that help you assess progress. For example, if the goal is to generate enquiries, website traffic alone may not tell the whole story. You may also want to track form submissions, calls, lead quality and the proportion of enquiries that become customers.
It is also helpful to distinguish between activity measures and outcome measures. Clicks and impressions can show how much exposure a campaign receives, while conversions and revenue provide a view of what that activity has contributed. Both can be useful, but they answer different questions.
Designing a dashboard people can use
A dashboard should be easy to scan and understand. Put the most important information near the top, group related measures together and use charts only where they make patterns clearer. Clear labels, consistent date ranges and brief notes can prevent confusion.
Where possible, include context. A figure is easier to interpret when it can be compared with a previous period, a target or a relevant benchmark. Take care with comparisons, however: seasonal changes, campaign changes and differences in how platforms measure activity can affect the results.
It can also be useful to include a short summary of notable changes and recommended next steps. This helps turn a collection of figures into a practical reporting tool.
Data quality and reporting frequency
Dashboards are only as reliable as the data behind them. Check that tracking is configured correctly, conversion events are defined consistently and duplicate or irrelevant data is not distorting the figures. When combining data from several platforms, remember that each may use different attribution methods and reporting rules.
Choose a reporting frequency that suits the purpose of the dashboard. Some paid campaigns may need frequent monitoring, while broader performance reviews may be more useful weekly or monthly. Avoid reacting to short-term fluctuations without considering the wider context.
Privacy should be considered too. Only include personal data when there is a clear and lawful reason to do so, and make sure access to reports is appropriate for the people using them.
Common dashboard mistakes
- Including too many metrics: An overloaded dashboard makes priorities harder to see.
- Tracking measures without a purpose: Every metric should help answer a relevant question.
- Mixing incompatible data: Differences in platform definitions can make direct comparisons misleading.
- Ignoring data quality: Incorrect tracking can lead to inaccurate conclusions.
- Reporting without interpretation: Figures are more useful when paired with context and next steps.
- Failing to maintain the dashboard: Goals, campaigns and tracking requirements change over time.
Making your dashboard work for your business
Start with a small number of clear objectives and build a dashboard around the information needed to assess them. Review it with the people who will use it, check whether it supports their decisions and refine it as your marketing develops.
A digital marketing dashboard is most effective when it is treated as a working tool rather than a one-off report. With relevant measures, dependable data and regular review, it can help your team understand performance, identify questions worth investigating and make more informed marketing decisions.
Digital Marketing Dashboards: 7 Frequently Asked Questions
- What is a digital marketing dashboard?
- Why should a business use a digital marketing dashboard?
- Which metrics should a digital marketing dashboard include?
- How do you create a digital marketing dashboard?
- Which tools can be used to build a digital marketing dashboard?
- How often should a digital marketing dashboard be updated?
- How can you ensure the data in a digital marketing dashboard is accurate?
What is a digital marketing dashboard?
A digital marketing dashboard is a visual report that brings together key data from channels such as your website, search campaigns, social media and email marketing. It displays selected metrics in one place, making it easier to monitor performance, compare results with your goals and spot trends. The most useful dashboards focus on the measures that matter to your business, rather than showing every available figure.
Why should a business use a digital marketing dashboard?
A business should use a digital marketing dashboard to bring key performance data from channels such as its website, search campaigns, social media and email into one clear view. This makes it easier to monitor progress towards goals, spot trends or issues, compare results over time and share consistent updates with colleagues. By focusing on relevant measures, a dashboard can also reduce time spent gathering reports and help the business make better-informed marketing decisions.
Which metrics should a digital marketing dashboard include?
A digital marketing dashboard should include metrics that reflect your business goals, rather than every figure available. Common measures include website traffic and conversions, organic search performance, advertising spend and return, social media engagement, email clicks, and leads or sales. Choose a focused set that shows both activity and outcomes, and add context such as targets or previous-period comparisons to make the results easier to interpret.
How do you create a digital marketing dashboard?
To create a digital marketing dashboard, start by defining your business goals and the questions the dashboard should answer. Choose a small set of relevant metrics, such as website conversions, organic traffic, advertising spend or qualified leads, then connect the tools that hold this data. Present the results in a clear, easy-to-scan layout, using consistent date ranges and comparisons with targets or previous periods. Check that tracking is accurate, add context where needed and review the dashboard regularly so it stays useful as your campaigns and objectives change.
Which tools can be used to build a digital marketing dashboard?
Digital marketing dashboards can be built with tools such as Google Looker Studio, Microsoft Power BI and Tableau, which connect data from platforms such as Google Analytics, Google Ads and social media accounts. For simpler reports, Microsoft Excel or Google Sheets may be enough, while data connectors can help bring information from multiple sources into one place. The best option depends on your budget, the platforms you use, the level of detail you need and who will view the dashboard.
How often should a digital marketing dashboard be updated?
A digital marketing dashboard should be updated often enough to support timely decisions, but the ideal frequency depends on your campaigns and goals. Paid advertising may need daily or near real-time updates so you can respond to significant changes, while SEO, email and overall performance are often best reviewed weekly or monthly. Set a consistent schedule, check that the data is reliable and avoid reacting to short-term fluctuations without considering the wider context.
How can you ensure the data in a digital marketing dashboard is accurate?
To ensure the data in a digital marketing dashboard is accurate, check that tracking tools and conversion events are set up correctly, use consistent definitions for metrics across platforms, and review integrations for missing or duplicated data. Apply suitable filters to exclude internal traffic or irrelevant activity, and compare dashboard figures with their original sources regularly. Document any differences in reporting methods, attribution or time zones, and investigate unexpected changes before drawing conclusions.
Leave a Reply